This module provides classes for time-activity curve (TAC) interpolation for Positron Emission Tomography (PET)
data. It enables the resampling of data evenly with respect to time, which is particularly useful when performing
convolutions with respect to time. We use scipy.interpolate.interp1d for the interpolation.
The EvenlyInterpolate class takes in TAC times and values and a specified delta time, \(\Delta t\), to
resample data by interpolating TACs evenly with respect to time.
The EvenlyInterpolateWithMax class extends the functionality of EvenlyInterpolate by modifying the
calculation of delta time, \(\Delta t\), to explicitly sample the maximum value of the TAC.
Example
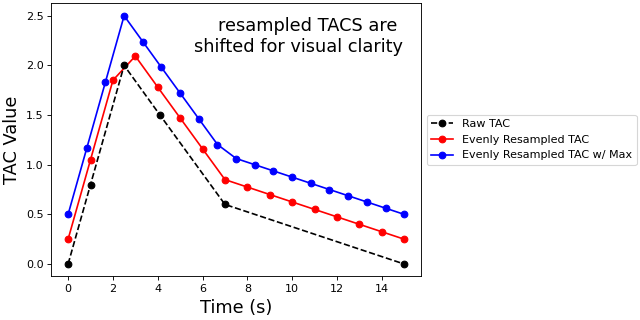
In the proceeding example, we shall use the two classes to resample a fake TAC. For better visualization, we shall
plot the resampled TACs shifted in the y-direction.
importnumpyasnpfrompetpal.kinetic_modeling.tac_interpolationimportEvenlyInterpolate,EvenlyInterpolateWithMaximportmatplotlib.pyplotasplt# define some dummy TAC times and valuestac_times_in_minutes=np.array([0.,1.,2.5,4.1,7.,15.0])tac_values=np.array([0.,0.8,2.,1.5,0.6,0.0])# instantiate EvenlyInterpolate object and resample TAC (and add shift for better visualization)even_interp=EvenlyInterpolate(tac_times=tac_times_in_minutes,tac_values=tac_values+0.25,delta_time=1.0)resampled_tac=even_interp.get_resampled_tac()# instantiate EvenlyInterpolateWithMax object and resample TAC (and add shift for better visualization)even_interp_max=EvenlyInterpolateWithMax(tac_times=tac_times_in_minutes,tac_values=tac_values+0.5,samples_before_max=3)resampled_tac_max=even_interp_max.get_resampled_tac()# plot the TAC and the resampled TACsfig,ax=plt.subplots(1,1,constrained_layout=True,figsize=(8,4))plt.plot(tac_times_in_minutes,tac_values,'ko--',label='Raw TAC',zorder=2)plt.plot(*resampled_tac,'ro-',label='Evenly Resampled TAC',zorder=1)plt.plot(*resampled_tac_max,'bo-',label='Evenly Resampled TAC w/ Max',zorder=0)ax.text(s='resampled TACS are \nshifted for visual clarity',x=0.95,y=0.95,ha='right',va='top',transform=ax.transAxes,fontsize=16)plt.xlabel('Time (s)',fontsize=16)plt.ylabel('TAC Value',fontsize=16)plt.legend(bbox_to_anchor=(1.0,0.5),loc='center left')plt.show()
Evenly interpolating TACs can sometimes miss the maximum value of the provided TAC given the
time-step. Therefore, we can explicitly include the maximum value by modifying the time-step.#
Note
This module utilises scipy.interpolate.interp1d for linear interpolation. Ensure Scipy is installed for
this package to function.
Todo
Test if the classes work correctly if the max value of the TAC is at the first or last time-point.